Configurable industrial edge I/O for sensors, meters, machines and equipment.
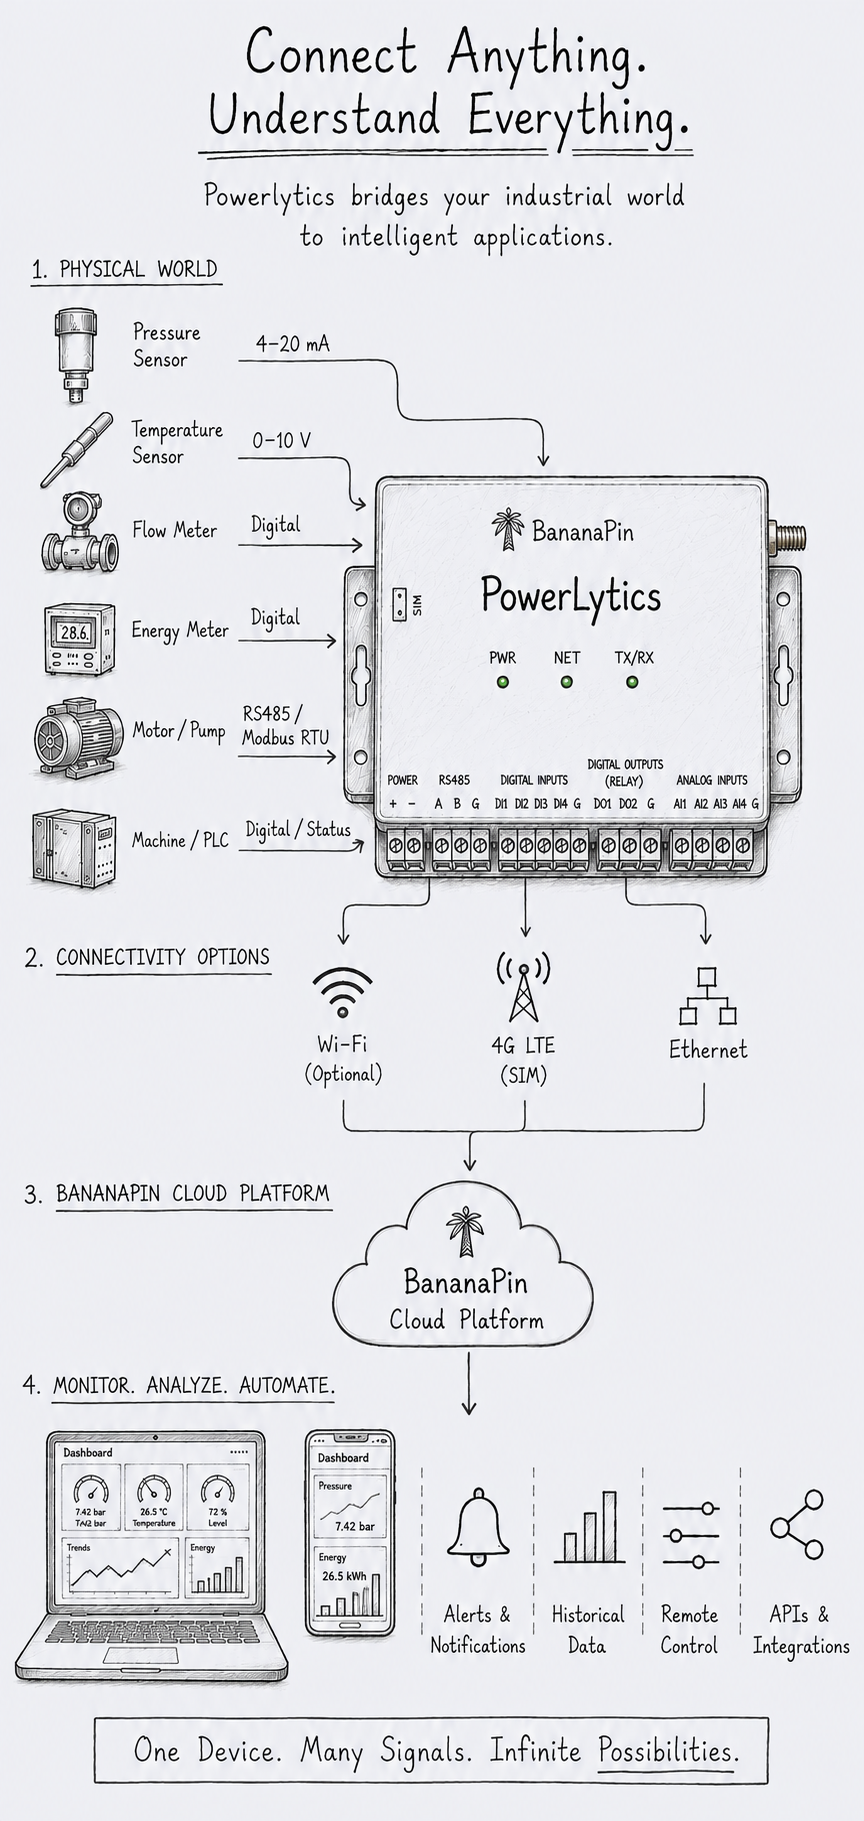
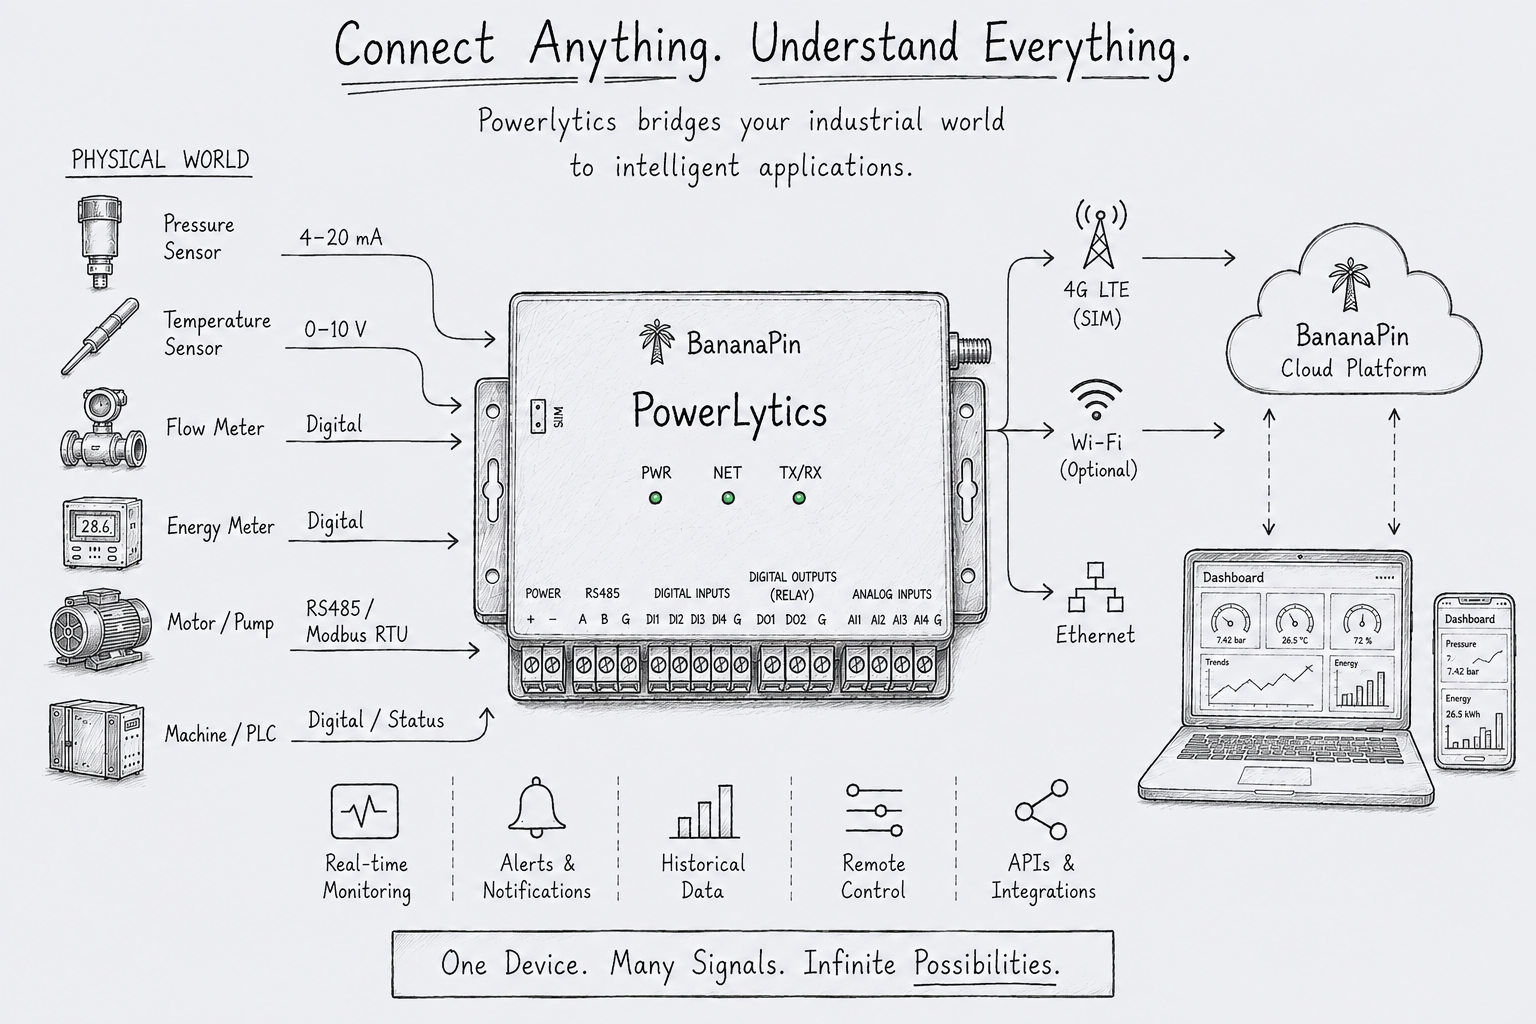
Powerlytics is a configurable industrial edge I/O and data-acquisition platform. It connects sensors, meters, machines and industrial equipment through analog, digital, relay and Modbus interfaces, processes signals locally at the edge, and securely delivers the data to your workspace over Ethernet, Wi-Fi or cellular — with remote configuration, alerting and control built in.


Claim a device into your workspace, then configure every port — digital, analog, or Modbus — name it, scale it, calibrate it.
Push the configuration live to the device, then watch telemetry land in real-time and historical dashboards, per device or fleet-wide.
Alerts fire on the conditions you define; actuation lets your team resolve issues remotely, and the audit log keeps a permanent record.
One hardware family, sized for the job — pick the I/O mix that matches the site, then choose Ethernet + Wi-Fi or cellular connectivity.
Modbus + control
Compact acquisition
General-purpose / balanced
High-I/O acquisition
Every port is documented down to the register — select an interface to see how it behaves.
An industrial DC input built for panel and field power, with protection designed in from the start rather than added after the fact.
| Input voltage | 9–36 V DC (target)Spec pending |
| Nominal supply | 12 V / 24 V DC |
| Reverse-polarity protection | Yes |
| Input fuse / current limiting | Yes |
| Transient & surge protection | Yes |
| Brownout handling | Yes |
| Power consumption (idle / typical / peak) | Published per model on datasheetSpec pending |
Claim a device and you're not just watching it — every port on the board is yours to set up.
Digital inputs, digital outputs, analog inputs, and Modbus inputs — configure each port on the board individually, not just the device as a whole.
Give every port a name, then scale and calibrate the raw value it reports until it reads exactly right.
Every Modbus slave and every register read on it is individually configurable.
Trigger a digital output — a relay, a switch — from anywhere, live.
Push a configuration change straight to the device over the air. No site visit, no manual reflash.
See the error and diagnostic logs coming off the device itself while it's collecting data — not just the readings it reports.
Every configuration change, deployment, and action is recorded — you always know what happened and who did it.
Once it's configured, every reading is yours to watch — as it happens, or however far back you need.
Every device streams data in real time into a single, searchable feed — not a batch report.
Watch any port's value plotted as it streams in, updating in real time.
Chart any port over any date range, or drop into a searchable table of every reading when you need the raw numbers.
Threshold and anomaly-based alerts route to the right person before small issues become outages.
The short version is above. Open a section below for the full picture.
Powerlytics is a configurable industrial edge I/O and data-acquisition platform that connects sensors, meters, machines and industrial equipment through analog, digital, relay and Modbus interfaces, performs configurable processing at the edge, and securely communicates application data through wired, wireless or cellular connectivity.
It's designed as a general-purpose industrial edge platform rather than a single-purpose sensor device — the same hardware family can be configured for a wide range of data-acquisition and control requirements, from a two-relay control box to a ten-channel acquisition unit.
Powerlytics is not a consumer IoT device, a generic Wi-Fi controller, a PLC replacement for every application, or a sensor itself — it's the configurable layer between physical industrial equipment and software systems.
Every input goes through the same pipeline before it reaches a dashboard: - Physical signal (e.g. 4–20 mA from a pressure transmitter) - Analog-to-digital conversion - Calibration (zero offset, gain, two-point correction) - Scaling (e.g. 4 mA → 0 bar, 20 mA → 16 bar) - Engineering value in a configured unit
The result is that a user sees "Pressure = 7.42 bar" on a named, calibrated variable — never a raw ADC count or an unlabeled register.
Everything above ships today. This is what we're building next — not yet available.
Additional RS485, CAN, more outputs and expanded I/O for larger deployments.
Higher environmental protection for unenclosed, outdoor sites.
On-device automation — e.g. "if pressure > 8 bar, close relay" — without a round-trip to the cloud.
Modbus TCP support alongside the current Modbus RTU over RS485.
Automatic fallback from Ethernet to Wi-Fi to cellular, with offline buffering when every link is down.
Route application data beyond the BananaPin workspace without exposing internal infrastructure.
There's no self-serve checkout yet — leave your number and someone from the team will call you to scope it out.